Pricing Analysis
FlexMLS comp analysis — scattergram, odds of selling, time to close.
| One-off run · Lead queue
Choose comps — 11481 E MANDARIN GLEN CIR, JACKSONVILLE, FL 32223Untick a comp to throw it out, then re-run. Sorted by distance from the Fair Market line, so the outliers sit at the top.
An excluded comp is dropped from every chart and from the regression — not just hidden on the scattergram. A band you saved is kept. Nothing is destroyed: untick, look, re-tick.
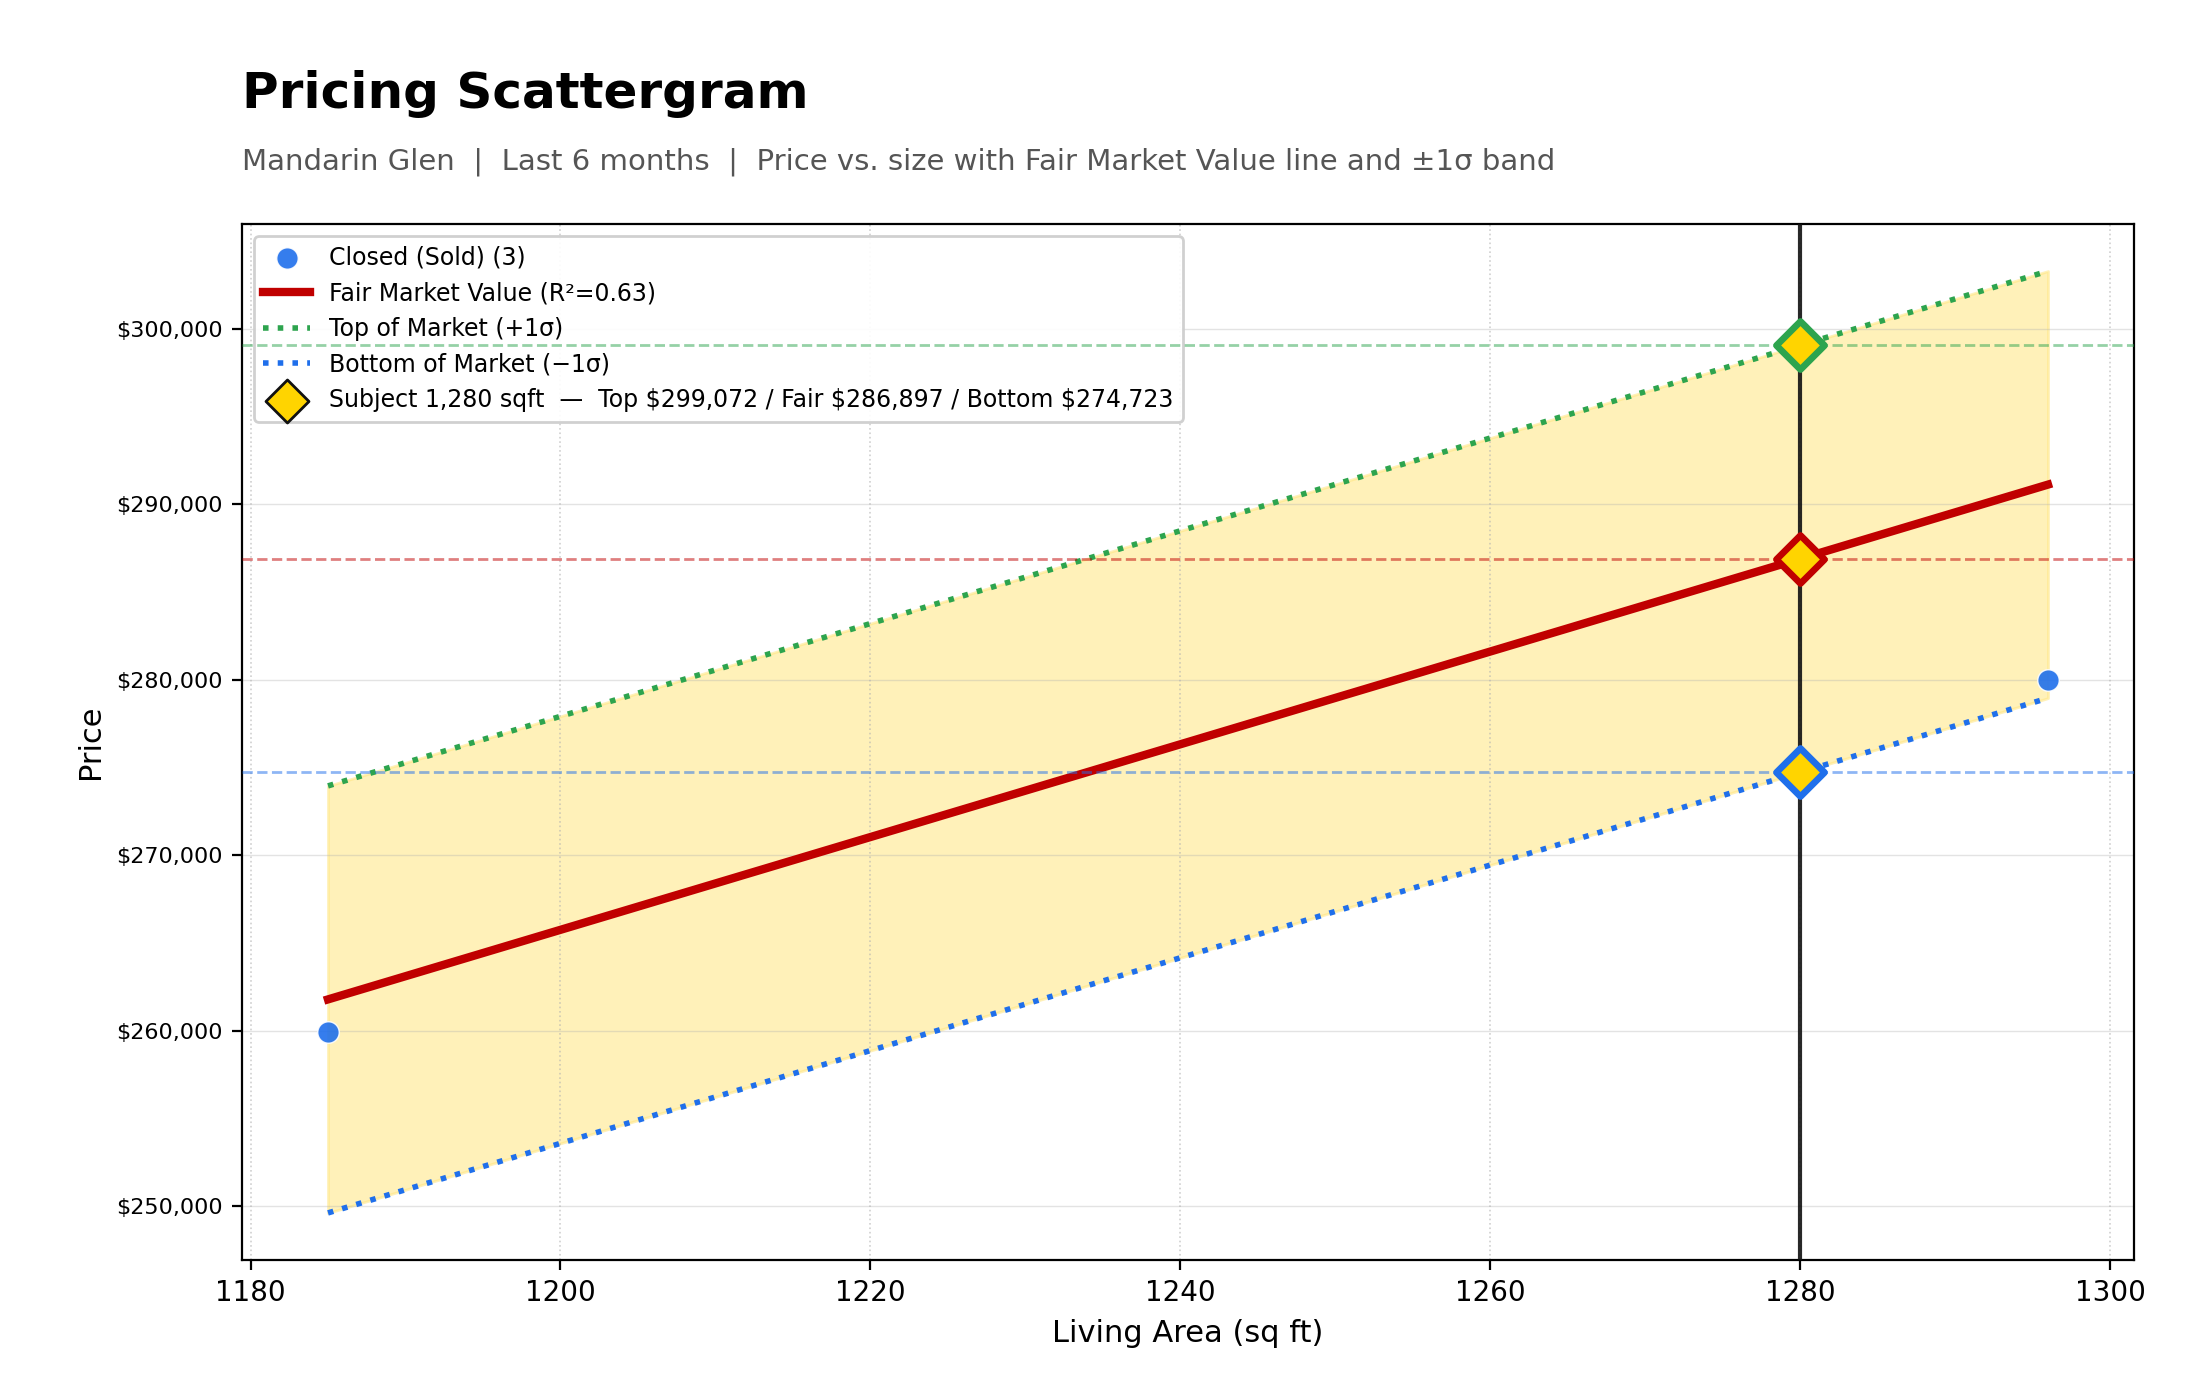
10 comps in the export · 3 plotted in the 6-month window · 3 set the Fair Market line · 0 excluded.
Fair Market line right now — built on
3 closed comps · R²
0.63 · 1σ band
$12,174Only the comps marked sets the line move this. Unticking a wild ACTIVE or PENDING listing tidies the scattergram but will not move the ARV by a dollar — the regression is fit on closed sales only. Watch these three numbers after each re-run: a jumping R² means you are cutting real market, not an outlier.
← Live scattergram · Back